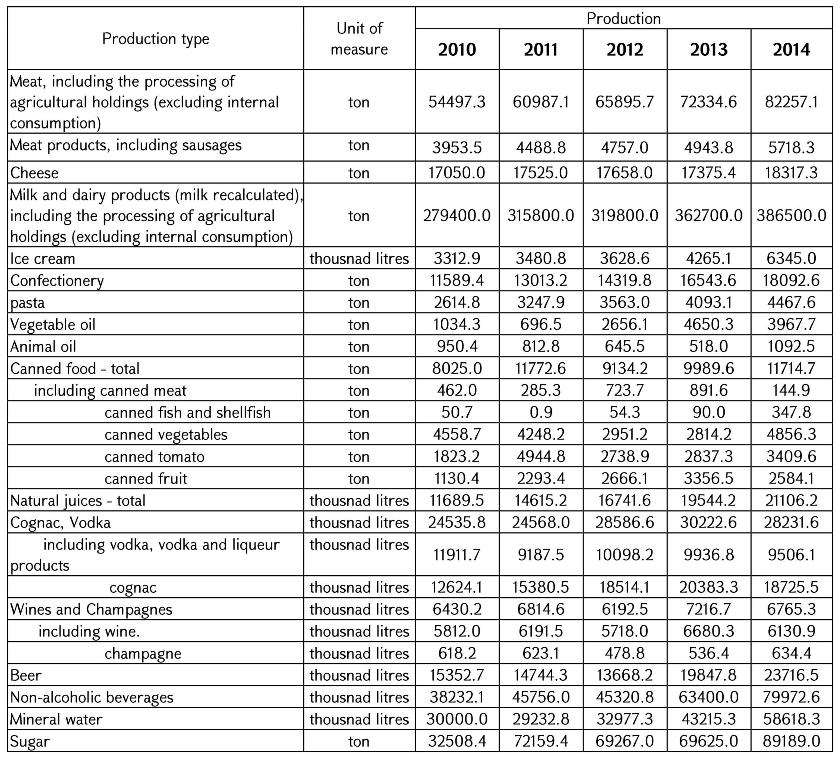
Table N 1
Production Volumes in the Period 2010-2014 Derived from RA Agricultural Product’s Processing
Table N 2
Main Production Types Derived from the Agricultural Raw-Materials Processing, the Level of Export, Import and Self-Sufficiency and the Share of Local Production in the Sales Structure in 2012-2014 Calculated According to the Data of the RA National Statistical Service and Customs Service
Table N 3
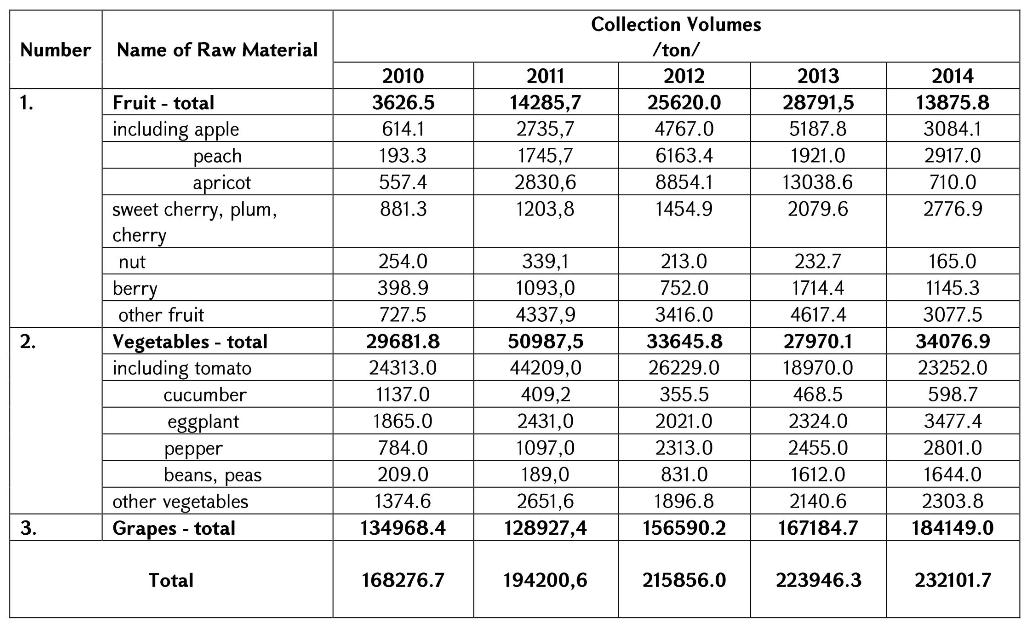
Collection Volumes of Fruits, Vegetables and Grapes in 2010-2014 by RA Processing Industry Companies

